Marine Food Webs
Be sure to write about what you are learning in the lab section of your notebook. You will be expected to answer questions about the lab activity during the lab self test and lab quiz. It helps to have your text and coloring books open beside you for support.
| Refer to the Assigned Readings Below: | |
| Marine Biology Textbook | Chapter 10, pages 221 to 225 |
| Marine Biology Coloring Book | Plate 14 |
| Food Webs in General | |
|
One
of the logical tools that an ecologist uses to understand how the
organisms of a community live together is to construct a food web.
The food web is a diagram representing the feeding relationships
among the species in the community; arrows are used to connect the
predators with their prey. The food web may then be used as a model
of the interconnectedness of the members of the community and as
a tool to make predictions of how a change in the abundance of one
species may affect the other species.
|
|
|
This is best illustrated by an example. Let's examine an example from a natural community with which we are all already familiar-the garden. Suppose we have a vegetable garden in which we are growing the following: carrots, lettuce, and strawberries. Suppose also that this being a normal garden, there are some animals which occasionally visit to forage on our efforts: your sister's turtle, some grasshoppers, robins, a gopher, snails, and your cat. Now let us consider who eats whom. The gopher feeds on the carrots; the grasshoppers, turtle and snails on lettuce; the robins eat grasshoppers and strawberries; and your cat dines on robins, grasshoppers, and gophers. From this information we can construct the food web below. Note the direction of the arrows indicates the direction of the food from prey to predator. |
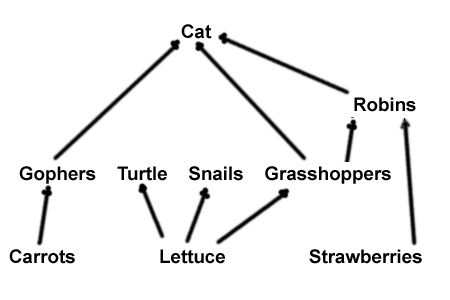 |
| The usefulness of this device might become apparent if you ask questions about the effect of reducing or increasing the number of certain species in this garden community, and then note the effect on the abundance of other community members. | |
| Question: Suppose that you remove the snails, what effect will this have on the lettuce, turtle and grasshoppers? | Answer:The lettuce would be free to grow and supply more food to the turtle and grasshoppers. |
| Question: What if you remove the strawberries and grasshoppers-what effect will this have on the abundance of robins in your garden? | Answer:The robins would have no food and would dissappear adversely affecting the diet of the cat. |
|
As you can see, there are many possible alternative situations where changing the abundance of one species can potentially affect the entire community. |
|
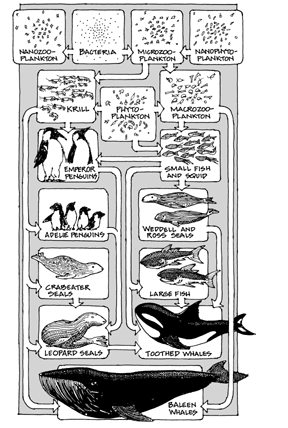
| Ocean Food Web | |
|
|
Use the ocean food web diagram to the left to answer the questions below it. |
| Questions | Answers |
| 1. Suppose phytoplankton decrease in abundance. What changes might occur in the abundance of other members of your web? | |
| 2. Could phytoplankton predators switch to different prey species? | |
| 3. Suppose phytoplankton increase in abundance. What changes might occur in the abundance of other members of your web? | |
| 4. Suppose macrozooplankton decrease in abundance. What changes might occur in the abundance of other members of your web? | |
| 5. Could macrozooplankton predators switch to different prey species? | |
| 6. Suppose macrozooplankton increase in abundance. What changes might occur in the abundance of other members of your web? | |
| 7. Suppose small fish and squid decrease in abundance. What changes might occur in the abundance of other members of your web? | |
| 8. Could small fish and squid predators switch to different prey species? | |
| 9. Suppose small fish and squid increase in abundance. What changes might occur in the abundance of other members of your web? | |
| 10. Suppose large fish decrease in abundance. What changes might occur in the abundance of other members of your web? | |
| 11. Could large fish predators switch to different prey species? | |
| 12. Suppose large fish increase in abundance. What changes might occur in the abundance of other members of your web? | |